DATA ANALYSIS
& REPORTING

Using various tools and techniques to collect, clean, and analyse large amounts of data to gain insights and inform business decisions.

The goal is to convert raw data into meaningful information that can be used to measure performance, identify trends, and inform strategic planning.

In the UK, there are various data analysis tools that are commonly used, such as spreadsheets, data visualisation tools such as Data Studio and Tableau, and statistical software like SPSS. These tools enable businesses to manipulate and make sense of their data, uncovering patterns, relationships and trends.

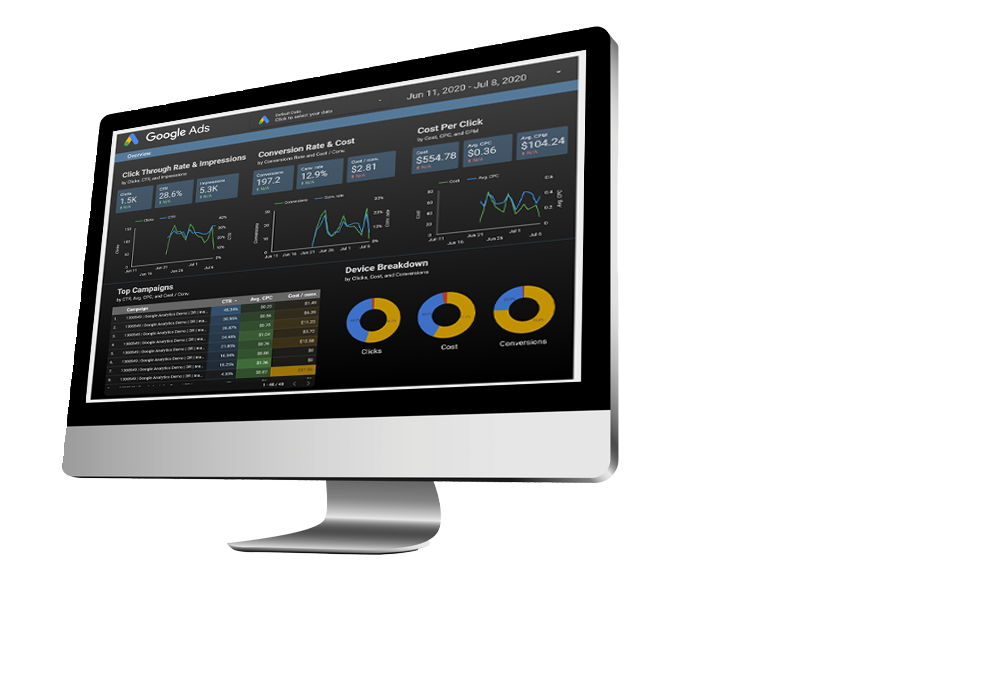
Once the data has been analysed, it is important to communicate the results in an effective and accessible manner. This is where reporting comes in, with the aim to present the insights in a clear, concise and easy-to-understand format, usually through the use of graphs, charts and tables.

WHY DATA ANALYSIS & REPORTING IS SO IMPORTANT

Data Analysis & Reporting is critical for a business as it helps organisations make informed decisions and achieve their goals. By analysing and reporting on data, companies can gain valuable insights into their operations and performance, enabling them to identify strengths, weaknesses, opportunities and threats.

Data Analysis & Reporting provides businesses with a comprehensive understanding of their customers, products, and operations. This helps companies to identify trends, track performance, and measure success, allowing them to make data-driven decisions and allocate resources more effectively.

Additionally, Data Analysis & Reporting helps organisations to identify areas for improvement and measure the impact of any changes they make. This allows companies to continuously optimise their operations, improve efficiency and increase profitability.

In today's fast-paced and highly competitive business environment, having accurate and timely information is essential. By using Data Analysis & Reporting, businesses can stay ahead of the competition, respond quickly to market changes, and make informed decisions that drive growth and success.
Reporting

FREQUENTLY ASKED
QUESTIONS

WHAT IS DATA STUDIO

Google Data Studio is a data visualisation and reporting tool developed by Google.

It allows businesses and organisations to connect their data from various sources, including Google Analytics, Google Sheets, and BigQuery, and create interactive reports, dashboards, and charts. Data Studio enables users to analyse and present data in a visually appealing and easy-to-understand format, allowing them to communicate insights and data-driven storeys to stakeholders.

With its user-friendly interface and integration with other Google products, Google Data Studio makes it simple to create and share customised reports and dashboards with team members and clients.

The tool is free to use and offers a range of customisation options, making it a popular choice for businesses and organisations looking to streamline their data analysis and reporting processes.

WHY IS IT IMPORTANT TO HAVE REGULAR REPORTING

Regular reporting from marketing is essential to track the effectiveness of marketing campaigns, measure the return on investment, and make informed decisions for future marketing efforts.

It provides insights into the target audience's behaviour, their engagement with the brand, and the impact of marketing efforts on sales.

Regular reporting helps identify what's working and what's not, allowing for real-time adjustments to be made to improve results. Without regular reporting, it's difficult to determine the success of marketing efforts and allocate resources effectively.

HOW OFTEN I SHOULD BE RECEIVING REPORTS ON MY MARKETING

The frequency of marketing reports depends on various factors, such as the type of marketing campaigns, the size of the business, and the goals of the marketing efforts.

For short-term campaigns, weekly or bi-weekly reports may be sufficient to track progress and adjust strategies as needed. For longer-term campaigns, monthly or quarterly reports are usually sufficient. For ongoing marketing efforts, such as social media marketing, a weekly or bi-weekly report may be more appropriate.

The key is to strike a balance between having enough data to make informed decisions and not overwhelming yourself with too much information. It's best to discuss the frequency of reporting with your marketing team to determine what works best for your specific needs and goals.

Google Data Studio is a data visualisation and reporting tool developed by Google.

It allows businesses and organisations to connect their data from various sources, including Google Analytics, Google Sheets, and BigQuery, and create interactive reports, dashboards, and charts. Data Studio enables users to analyse and present data in a visually appealing and easy-to-understand format, allowing them to communicate insights and data-driven storeys to stakeholders.

With its user-friendly interface and integration with other Google products, Google Data Studio makes it simple to create and share customised reports and dashboards with team members and clients.

The tool is free to use and offers a range of customisation options, making it a popular choice for businesses and organisations looking to streamline their data analysis and reporting processes.

Regular reporting from marketing is essential to track the effectiveness of marketing campaigns, measure the return on investment, and make informed decisions for future marketing efforts.

It provides insights into the target audience's behaviour, their engagement with the brand, and the impact of marketing efforts on sales.

Regular reporting helps identify what's working and what's not, allowing for real-time adjustments to be made to improve results. Without regular reporting, it's difficult to determine the success of marketing efforts and allocate resources effectively.

The frequency of marketing reports depends on various factors, such as the type of marketing campaigns, the size of the business, and the goals of the marketing efforts.

For short-term campaigns, weekly or bi-weekly reports may be sufficient to track progress and adjust strategies as needed. For longer-term campaigns, monthly or quarterly reports are usually sufficient. For ongoing marketing efforts, such as social media marketing, a weekly or bi-weekly report may be more appropriate.

The key is to strike a balance between having enough data to make informed decisions and not overwhelming yourself with too much information. It's best to discuss the frequency of reporting with your marketing team to determine what works best for your specific needs and goals.

READY TO EXPLORE?